Quantifying the power of the 1st-pitch strike
When I was a beat reporter covering the Pirates in the mid-2010s, Pittsburgh manager Clint Hurdle often arrived at his postgame press conference with a few folded pages of notes. One item he almost always scribbled down and recited was the rate at which that day's starting pitcher got ahead of opposing batters.
In some ways, baseball is that simple.
Count leverage - whether a batter or pitcher is ahead or behind - is sometimes referred to as baseball's line of scrimmage, and for good reason. Amid their offensive struggles this season, Pirates hitting coach Andy Haines made that analogy this week when speaking with MLB.com's Alex Stumpf.
Count leverage tilts the probability of a positive outcome in one's favor. Earn it often enough, and you'll improve your odds of winning the game.
For instance, entering Thursday's games, the 10 teams that throw the most pitches ahead in the count have a median team ERA of 3.53. The bottom 10? A 4.70 median ERA.
Another way of looking at it: these top 10 teams had a 177-133 record, while the bottom 10 were 124-183 entering Thursday.
It boils down to something even simpler: who wins the first pitch.
Many know this fundamental concept, but the performance gap between a 1-0 count and an 0-1 count might come as a surprise. There's a difference of about 200 OPS points between a plate appearance that starts with a ball (.790) and one with a strike (.584). The league average OPS is .696, so that's the difference between a borderline All-Star and a replacement-level player.
This spread is nearly constant through the years. The gulf in OPS after a first-pitch strike and a first-pitch ball is 207 points this year. It was 206 points last year. It was 210 points in 2020, 209 points in 2010, 225 points in 2000, 202 points in 1990, and 199 points in 1988, the first year of pitch-level data available at Baseball Reference.
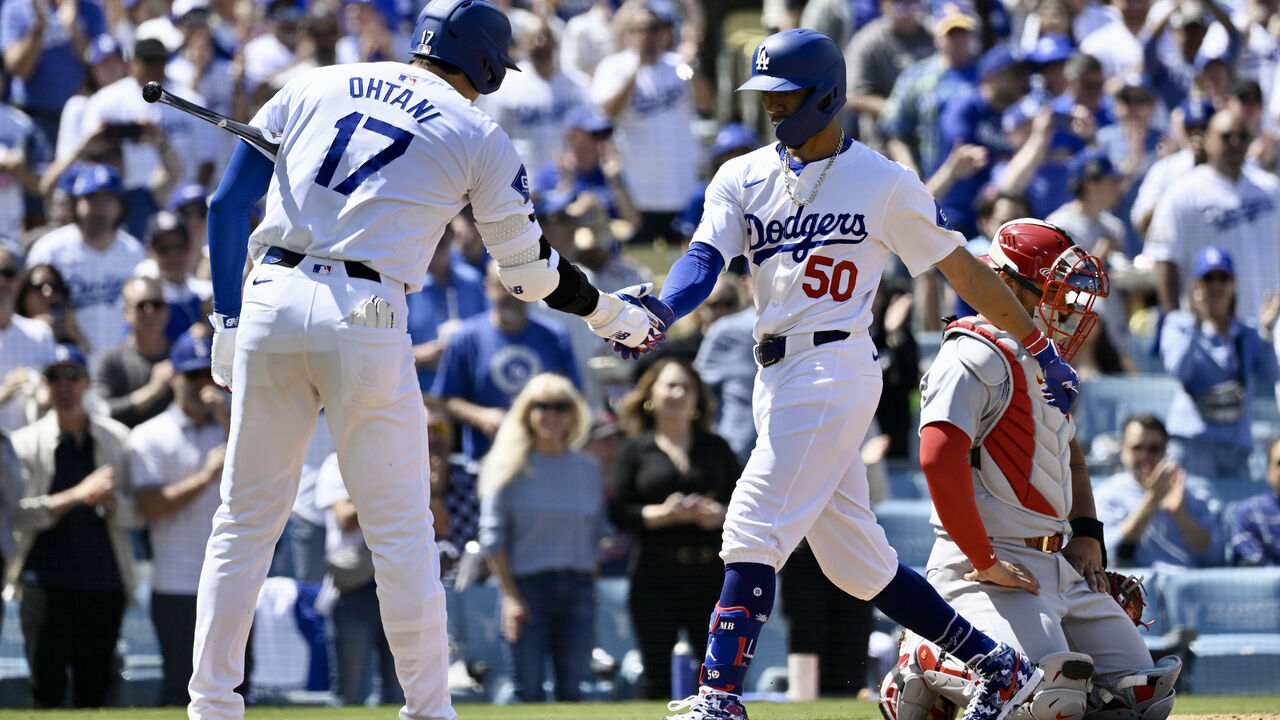
The teams leading the majors in 1-0 counts by their batters through play Thursday? The Yankees and Dodgers, both with more than 500 so far.
The Dodgers enjoy an .885 OPS after a plate appearance begins with a 1-0 count, compared to a .680 OPS after an 0-1 count. The Yankees' split is more modest at .735/.629
Either way, the lesson is: get ahead.
Not only do the Dodgers have several discerning hitters, but opponents so fear their lineup that they're less likely to attack the zone. That only places opponents in a more difficult position. The Dodgers lead the majors in runs scored (177), and wRC+ (129).
There are two teams with fewer than 400 1-0 counts as hitters: the Colorado Rockies and Chicago White Sox. They're arguably the two worst major-league teams, ranking 30th (Rockies, 77) and 28th (White Sox, 74) in wRC+. The White Sox rank last in runs scored.
On the mound, the Red Sox have had a dramatic turnaround (MLB-best 2.60 ERA) in part because new pitching coach Andrew Bailey made getting ahead early a focus in camp. Boston pitcher Tanner Houck increased his first-pitch strike rate from 61% to 65% this year.
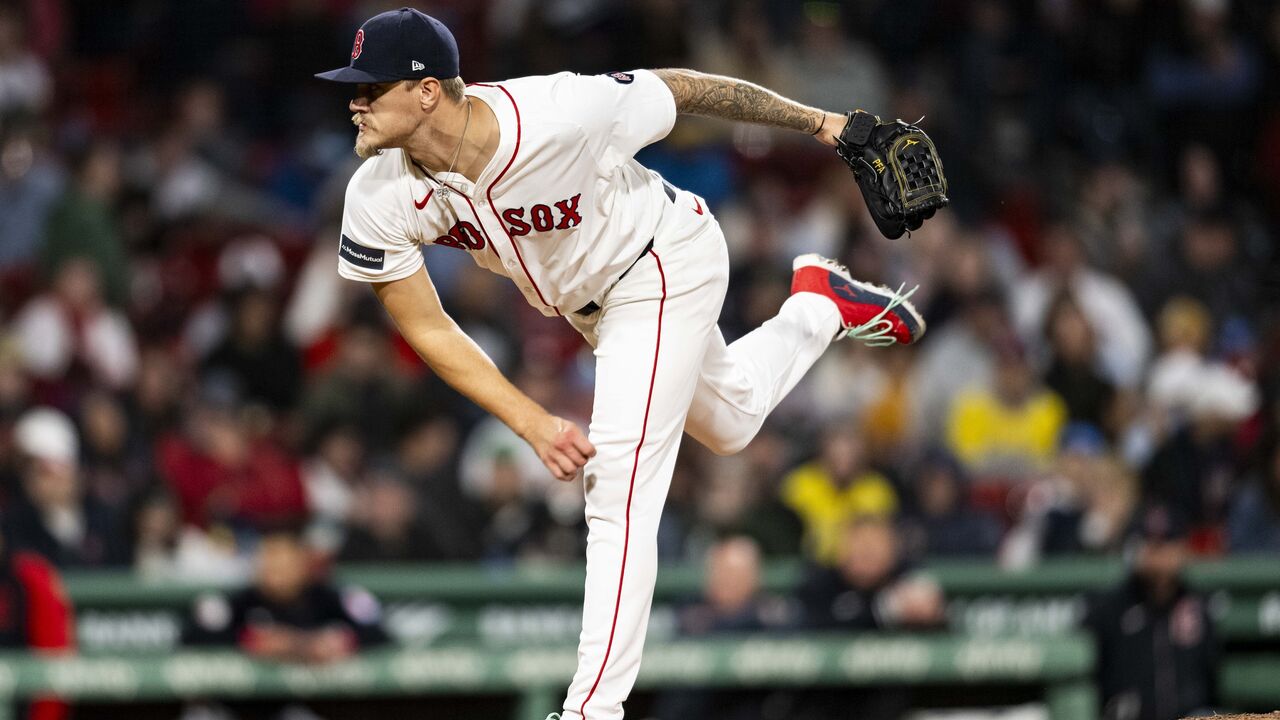
"It was as simple as, 'We gotta get you in the zone more with your stuff,'" Houck said.
While an avalanche of data and information floods the game, winning games often starts with Step 1, and that's pitch No. 1.
Travis Sawchik is theScore's senior baseball writer.